health
Run /health (or /doctor) to print a diagnostic overview of
the current session. The output renders inside a rounded border
box as a tree-style layout covering seven sections:
| Section | What it shows |
|---|---|
| Session | ID, file, name, CWD, branch/entry counts |
| Model | Provider, ID, context window, max output, reasoning, thinking level, input modalities |
| Context | Token usage with percentage, OK / Warning / Critical status |
| Tools | Active vs total count, active tool names |
| Commands | Registered count with per-source breakdown |
| Extensions | Active theme name |
| Environment | Tallow version, framework version, Node version, platform, install mode, build freshness, executable path, and home/package directories |
Commands
Section titled “Commands”| Command | Description |
|---|---|
/health | Show session diagnostics |
/doctor | Alias for /health |
Screenshot
Section titled “Screenshot”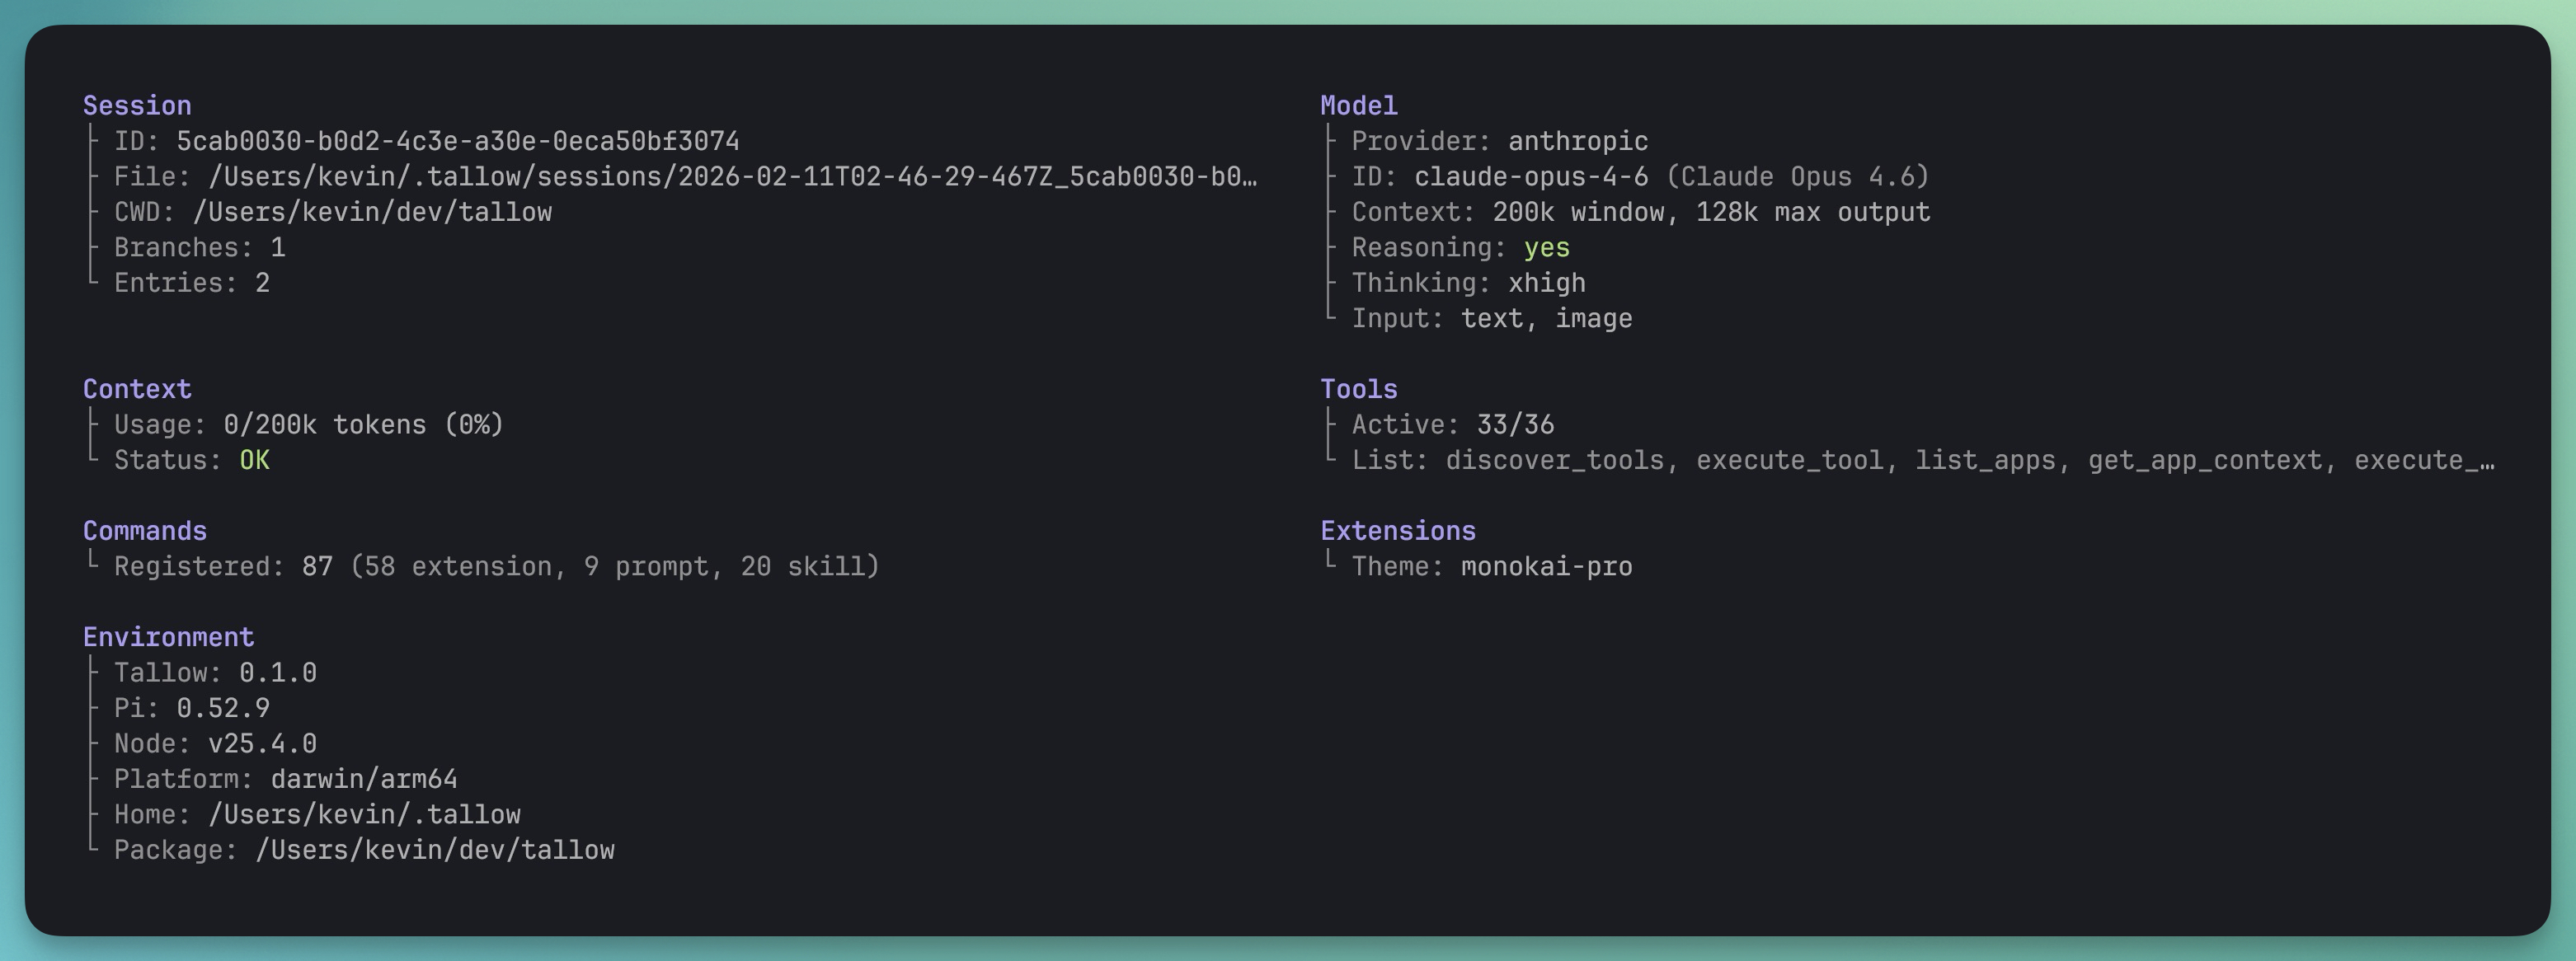
Responsive layout
Section titled “Responsive layout”The output adapts to terminal width:
- < 80 columns — single column, sections stacked vertically
- 80–159 columns — two columns side-by-side
- ≥ 160 columns — three columns
Long values (e.g. tool lists) are truncated with … to prevent
overflow.
Runtime provenance
Section titled “Runtime provenance”The Environment section also shows how the current CLI was launched:
- Install —
published package,linked local checkout, orsource checkout - Build — whether a local checkout is
freshorstale - Exec / Exec→ — the invoked executable path and its resolved realpath
- Package / Package→ — the configured package directory and its resolved realpath
This is the quickest way to confirm whether tallow is running from
an installed package or a linked local checkout with stale dist/
output.
Context status
Section titled “Context status”| Status | Condition |
|---|---|
| OK | ≤ 50% context used |
| Warning | 51–80% |
| Critical | > 80% |